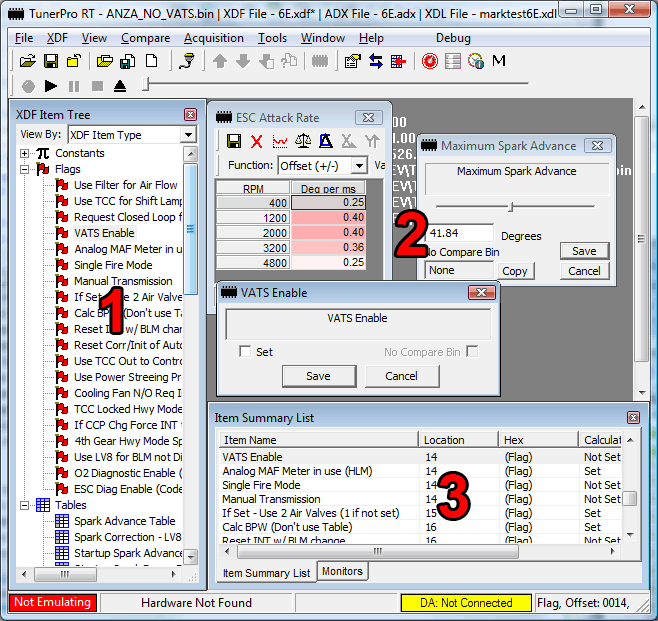
A screen capture of a typical TunerPro screen layout is shown below (TunerPro RT screen shown). The three major areas are marked in the screenshot.

UI Components |
| Title Bar | At the very top of the main window is the application title bar, as is typical with most Windows applications. The title bar shows the currently open BIN, XDF, ADX, and XDL files, as well as their modified state. A file with an asterisk ('*') after it has been modified, and the changes have not yet been saved to disk. |
| Main Menus | Below the title bar is the main application menu, as is typical with most Windows applications. The menus allow you to direct access most of features of the application. |
| Main Toolbar | Immediately below the menu is the application's main toolbar. The toolbar is designed to give you quick access to the more commonly used features and commands, and it is broken down into groups. You can show and hide toolbar groups, or the toolbar completely, via toggling the group in the View->Toolbars menu, or by right clicking in the toolbar. |
| XDF Item Tree (1) | Under the '1' at the left side of the illustration above is the XDF Item Tree. This tree list exposes all of the editable items in the XDF definition that you've loaded. Double clicking an item in the list will open the items respective binary editor in the workspace to the right ('2' in the illustration). The XDF Item Tree can be arranged in various ways, depending on the selection in "View By" at the top of the tree window. You can arrange items in the list by type, category, or in a flat, ordered list. If you wish to rearrange the order of XDF items in the tree, you must do so in the "Ordered List" mode. The tree can be closed by clicking in the 'X' in the top right corner of its window. It can be re-opened from the View menu or View toolbar. |
| Workspace (2) | Under the '2' in the illustration above is the main editor workspace. This is where all binary editors will be opened when you double click an item from the XDF Item Tree. Multiple editors can be open within the workspace simultaneously. |
| Bottom Utility Tab (3) | Under the '3' in the illustration is the bottom utility tab. Many of the utility windows accessible from the menus and toolbars will open in this tab view, including the Item Summary List, Item Comments, and all of the data acquisition views (TunerPro RT). |
| Main Status Bar | At the very bottom of the main application window is the main status bar. This status bar shows various data points, including the current emulation state, data acquisition state, and info about the detected hardware (TunerPro RT), as well as quick information about the XDF Item currently selected in the XDF Item Tree. A more detailed description of the status bar can be found below. |
![]()
Parts of the status bar:
1: Emulation Status (RT Only) - If green, you are currently emulating. Changes made to the bin (via the update buttons, sliders, and graphs) are updated to the emulator and made immediately availabe to the car.
2: Connected Hardware Status (RT Only) - This shows information on the hardware actively connected to TunerPro.
3: Progress Bar and TunerPro Status (RT Only) - This shows the current progress of active tasks, including emulation upload, download, and verification. This area also shows the current status of any attached hardware and results of certain operations performed within TunerPro.
4: Data Acquisition Status (RT Only)- This portion displays the current data acquisition connection status and data acquisition log playback status.
5: General Data - This portion displays general editor data such as basic information on the item currently selected in the XDF item tree. TunerPro Basic contains only this portion of the status bar.